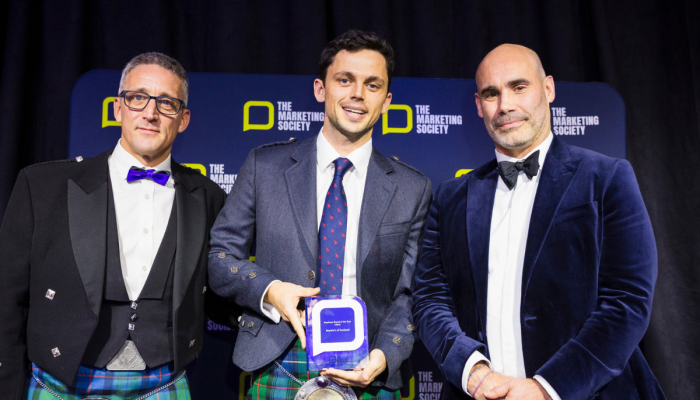
Andrey Vinitsky is Commercial Director & Co-founder at Nullmighty - a leading data visualisation company that focuses on developing digital experiences to visualise stories and data. They help businesses present their data in a way that yields understanding, insight and patterns. This approach leads to more confident decision-making, greater operational efficiency and reduced risk.
We caught up with Andrey ahead of his appearance at this year's Digital Day to find out a little more about Nullmighty and Data Visualisation
What is Nullmighty?
At Nullmighty we build digital interactive experiences to analyse, discover and describe complex data. We enable organisations to make data driven decisions and to engage with their stakeholders through the use of data visualisation and data storytelling.
The visualisations we design take the form of interactive digital experiences where data is presented in an appealing and journey-like way, inviting users to discover patterns and trends across large data sets.
How was your start-up journey?
I started Nullmighty 2 years ago with my co-founder Roman Evans, with a simple vision to make data more accessible to everyone and to enable data driven decisions within organisations. In the past two years, we have enjoyed collaborations with clients from different sectors: large and small; international and local; public and private sectors.
Why should companies consider data visualisation and visual storytelling when presenting data? What’s the benefit?
Data Storytelling can help marketers to achieve their communication goals in many ways.
- Enable them to make data driven decisions.
- In a world where we are all suffering from information overload and data glut, interactive visualisations provide meaning and value. Helping us to answer complex questions in seconds.
- Interactive Data Visualisations can “Make Your Message Stick”.
- It’s engaging and can make your audience to spend hours playing with beautiful stats and meaningful information.
Can you give us an example of a company that is doing it well?
Companies use Data Visualisation tools and techniques for internal analysis (Uber, Airbnb, Microsoft, IBM…) or as part of their product (Asana, SalesForce, Youtube Analytics…)
Marketing agencies and marketing departments are visualising data to measure, understand and manage marketing performance which maximises the effectiveness of a campaign and optimises return on investment. They are also using Data Storytelling as part of their communication strategy.
What does the future of data visualisation look like?
The future of Data Visualisation is bright and beautiful. As business users become more data competent, they want to use more complex visualisations. Speaking from my own experience, some of them are not happy with simple line and bar charts - they want to look deeper into the data. They want to see a holistic picture of what is happening in their organisation and that’s why they are working with Nullmighty.
Tickets for Digital Day are available here.
Keep up with Nullmighty on Twitter


